
1
National Register of Historic Places: GIS Webinar
Cultural Resource GIS Facility
National Park Service
June 2012
National Register Draft Electronic Map Policy Factsheet
Required:
•
•
•
•
•
•
•
•
•
•
WGS/NAD datum
A map that very clearly labels the property being nominated. The point or district should be instantly
distinguishable from the rest of the map.
A scale.
A north arrow.
Reproducibility in black and white (same standards for black and white reproducibility as a site map.)
Decimal degrees for each point, extending to at least six decimal places.
It can be, but does not have to be on a continuation sheet.
Provide a large scale map that depicts the entire nominated property within the
full extent of the map. (A close up view.)
Provide a small scale map that depicts the nominated property in a wider context (similar to the scale of
the USGS topo map).
(Note: It is still acceptable to use hardcopy USGS maps and follow the previous map standard.)
In February and March 2012 the National Register of Historic Places held webinars in conjunction with the National Park
Service, Cultural Resource GIS Facility to discuss the use of Geographic Information Systems (GIS) to help produce paper
locational maps and defining coordinates for submittal with nominations. The webinars discussed the draft policy
change currently being implemented by the National Register program outlining options and alternatives for submitting
UTM coordinates and paper USGS quadrangle maps. The draft policy allows for the inclusion of latitude/longitude
coordinates instead of or in addition to UTM coordinates. The policy also allows for the submission of computer
generated locator maps instead of USGS quadrangle maps.
The webinars provided examples of three different, free, internet-based tools to acquire coordinates and generate the
necessary maps. Using a full GIS software package, such as ESRI’s ArcGIS, would allow for the most flexibility in
generating the required paper maps or coordinates for a nomination. The expense of full GIS software however is
sometimes prohibitive for casual users. The intent of the National Register GIS webinars is to offer alternatives that will
produce the required maps and coordinates for a nomination, taking advantage of other available free alternatives. All
of the applications discussed in the webinars can produce the required locational information for a nomination, however
some function better for resources represented by a single point, while others function better for resources over 10
acres that require bounding coordinates.
BING Maps (ht
tp://www.bing.com/maps/
)
BING Maps, much like Google Maps, use an internet browser to provide basic street maps, navigation directions and
o
ther viewing tools. Because many users do not have administrative rights on their computers, BING Maps is a good,
quick, source for generating latitude/longitude coordinates, without having to install any software or download
anything. The National Register draft policy allows for the inclusion of latitude/longitude coordinates in the form of
decimal degrees, or a decimal format of the typical degrees, minutes, seconds usually displayed with latitude/longitude.
Storing decimal degree coordinates instead of UTM coordinates will allow the National Register program to easily view
National Register sites nationwide using GIS software.
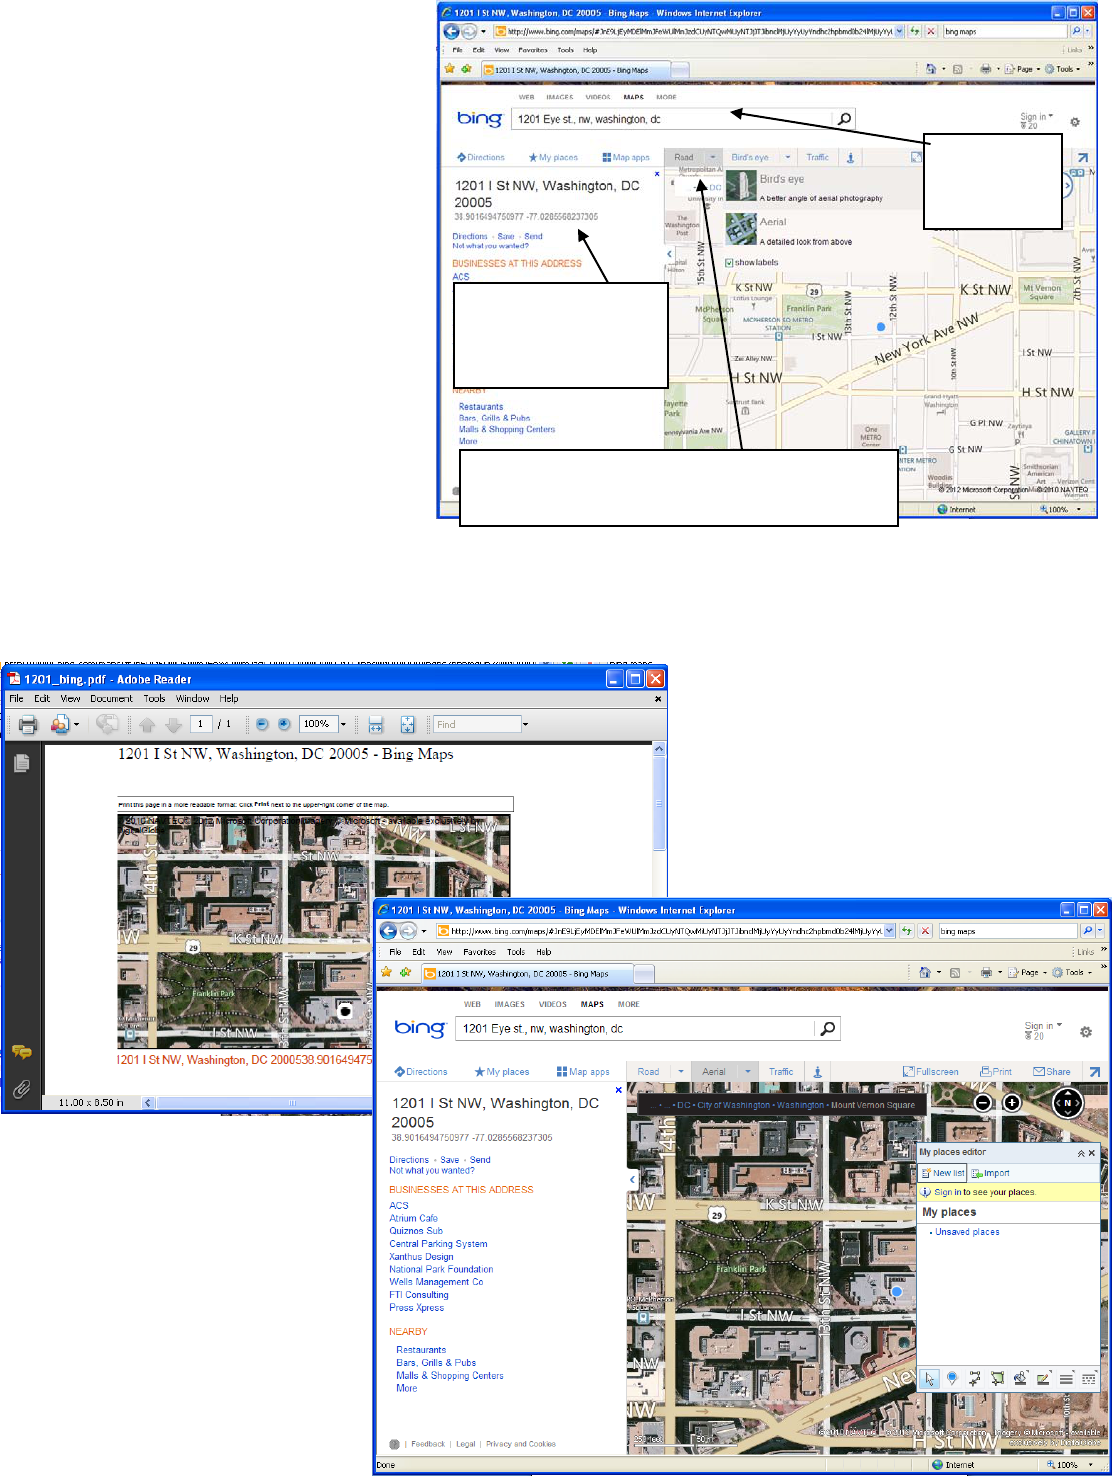
With BING Maps, typing an address into the search box at the top of the browser finds the location of the building, and
displays the decimal degree coordinates
associated with that location. BING Maps also
allows users to add locations as points or draw
boundaries, such as an historic district. These
point and area locations can be saved and
exported to a file format, such as a .kml or
.kmz, which can be read or used by Google or
other GIS software. Further, background
imagery in BING can be changed from simple
roads to more detailed aerial photography,
helping the user to better identify an historic
resource. Once the user has identified the
resource of interest with either a point or a
boundary, BING Maps can produce a paper
map, with a scale and basic information
required for a nomination locator map.
BING Maps provide basic information and
functions extremely well to get coordinates
for single buildings and urban resources.
Providing bounding coordinates for an area larger than 10 acres, as required for a National Register nomination, is much
more difficult. BING only supplies coordinates when an address is typed into the search. Other requirements for a
nomination, such as acreage for a site, can be calculated with BING Maps, however; the units of that measure cannot be
changed.
Type in the
address to
search
Note display of
coordinates in the
proper format
Use the menus to change the background
from roads to aerial images
From the File and Print menus, users can
choose to print out a paper map directly, or
print to a .pdf file. The image of your point
location and the background you choose
will be automatically placed on the paper,
along with the decimal degree coordinates
and the address that you typed in to the
search box.
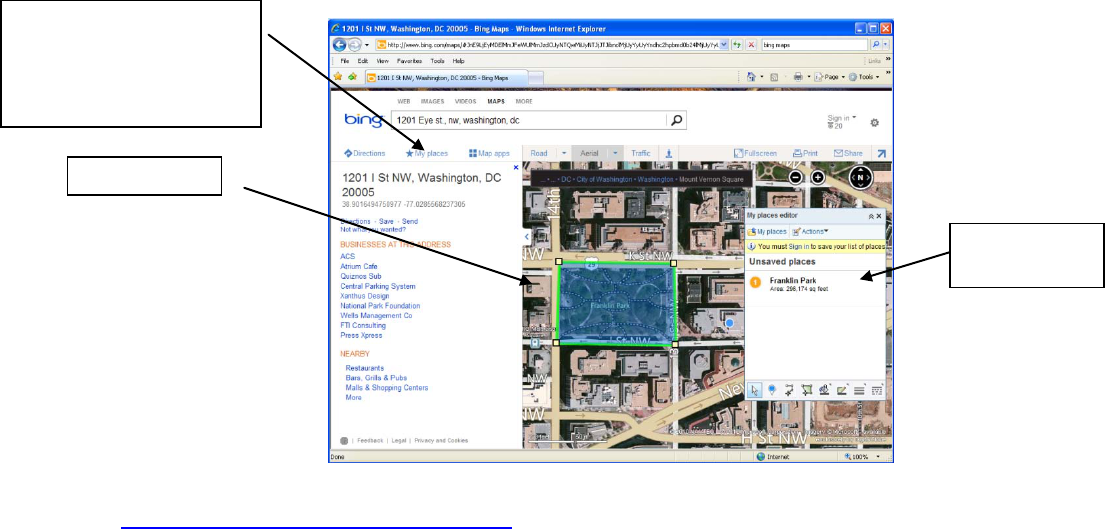
Clicking on the My Places menu option at the top of the browser will open a small dialog box that allows the user to
place a push pin directly on the map, or draw an area feature.
Drawing an area feature using the tools in the My Places dialog box will allow users to define district or site boundaries
and g
enerate area figures, however, the area is always calculated in square feet. It is important to note that coordinates
are not provided for the various points identified as corners when drawing the area feature. This will make it difficult to
provide the bounding coordinates for an area for a National Register nomination.
Google Earth (
http://www.google.com/earth/index.html)
Google Earth, unlike BING Maps or Google Maps, uses an internet based application to provide aerial photographs,
navigation directions, drawing tools and other geographic searching mechanisms. Google Earth is a very familiar
application to many users and is relatively intuitive to use. As a separate application, it does require users to download
and install the application, which can lead to problems with administrative rights. As an independent application
however, it offers more flexibility than BING Maps or Google Maps, particularly in finding or generating
latitude/longitude coordinates.
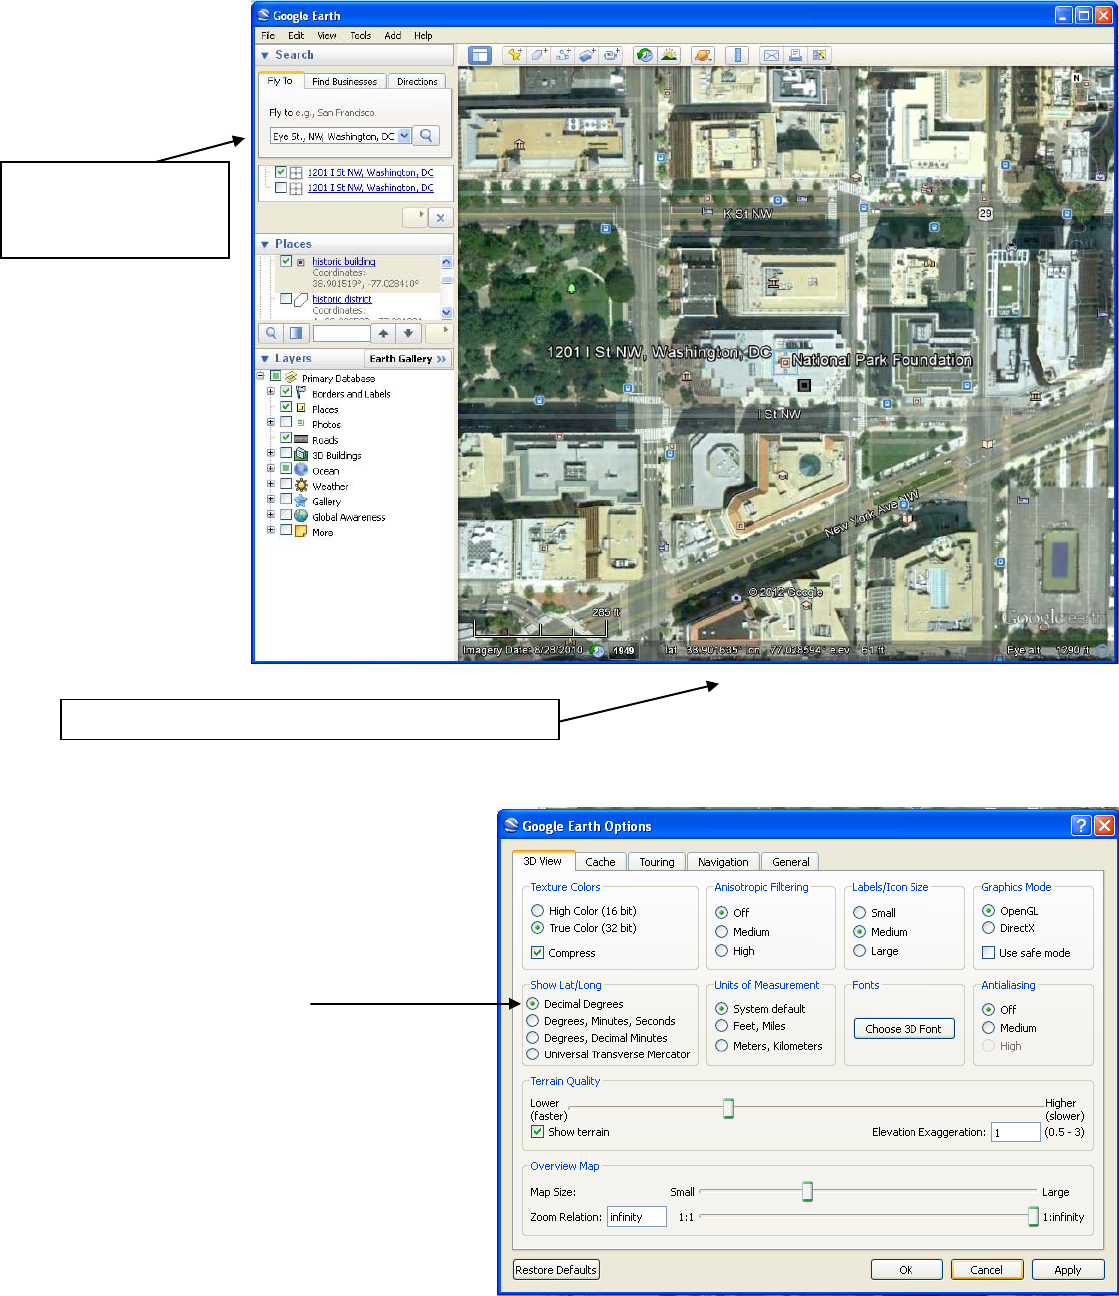
With Google Earth, typing an address into the search box at the top of the application window finds the location of the
building. Moving the cursor on the screen updates the display with coordinates for where ever the cursor moves.
Unlike BING Maps, with a static display and only a set of coordinates based on address, Google Earth constantly displays
coordinate information on the screen, updating and moving with the user as the display is manipulated. Rather than
generating a single latitude/longitude pair, Google Earth always indicates the coordinates of the cursor, whether the
user searched for the location or is just exploring the map.
Area feature
Square feet
calculations
Clicking Actions and
Export from the My
Places dialog allows users
to export the data
Google Earth will provide the same basic information as BING Maps or Google Maps, although it will make finding
coordinates for bounding areas, contributing resources, or multiples resources much easier for the user. Simply moving
the cursor to the appropriate location will generate a coordinate which can be marked on the map or copied into a
document for submission to the National Register. Other requirements for a nomination, such as acreage for a site,
cannot be calculated, however; paper maps are easily produced and the data can be exported as a .kml or .kmz file, like
BING Maps.
Unlike BING Maps, the
background display will
always be aerial
photography, although
historic aerial imagery
can be examined also.
Users can choose how the coordinates are
displayed in the application interface, either as
decimal degrees, traditional
degrees/minutes/seconds or even UTM
coordinates. Clicking the Tools menu and selecting
Options opens a dialog box that allows the user to
change coordinate systems. Select the radio button
next to Decimal Degrees.
Similarly, clicking the View menu and selecting
Scale Legend will add a scale bar to the map display
window, as well as any paper map you produce.
Type in the address
to search, or a city
name, keyword, etc.
Note the display of coordinates, always on screen
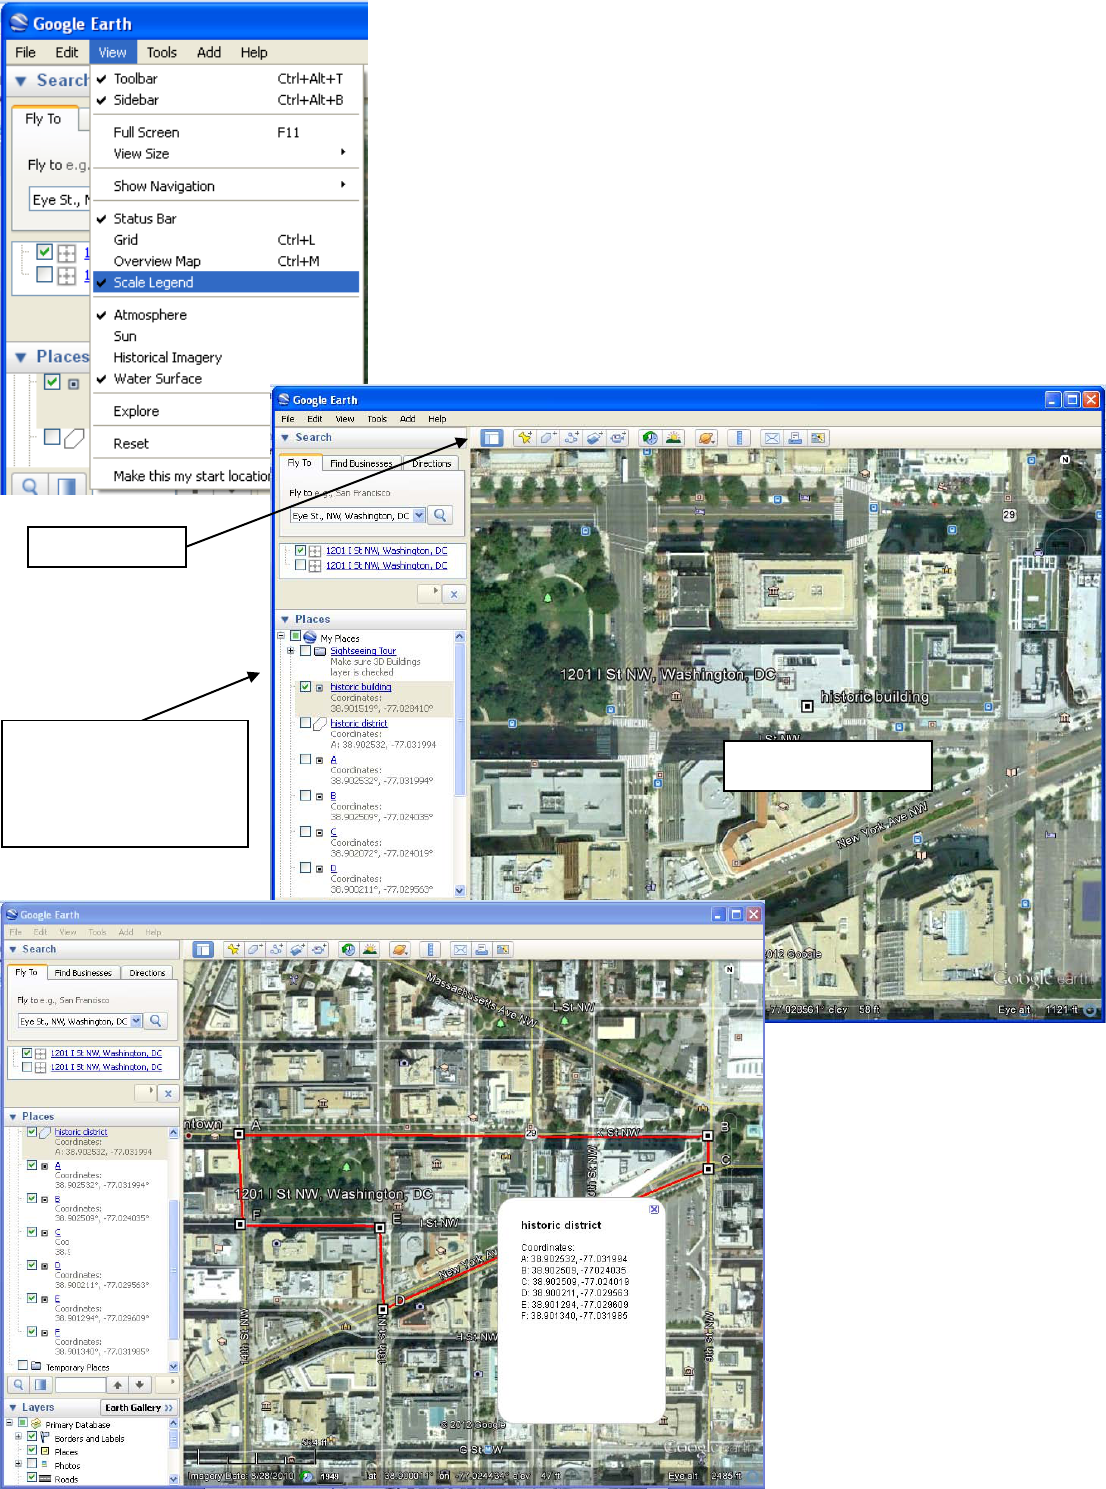
Drawing to
Tools at the top of the application interface allow users to create placemarks
(po
ints) or to draw area feature or measure distances. Placemarks or area
features created by a user can be named and labeled for the map display or
the paper maps produced. Once these features have been created, they will
also appear on the left side of the screen in the Places window. There, the
user can turn the features on and off, change the colors or symbols and
otherwise edit the features.
ols
Placemark, labeled
w, with
d area
d, along
Note that area features can be
easily drawn and labeled like a
traditional National Register
nomination locator map, with
each coordinate labeled
clockwise around the feature.
Editing the properties of a
placemark or area feature allows
Places windo
placemark an
features liste
with labels
the user to create labels, change colors and alter symbols. Right click on the feature in the Places window and select
Properties to open the dialog box.
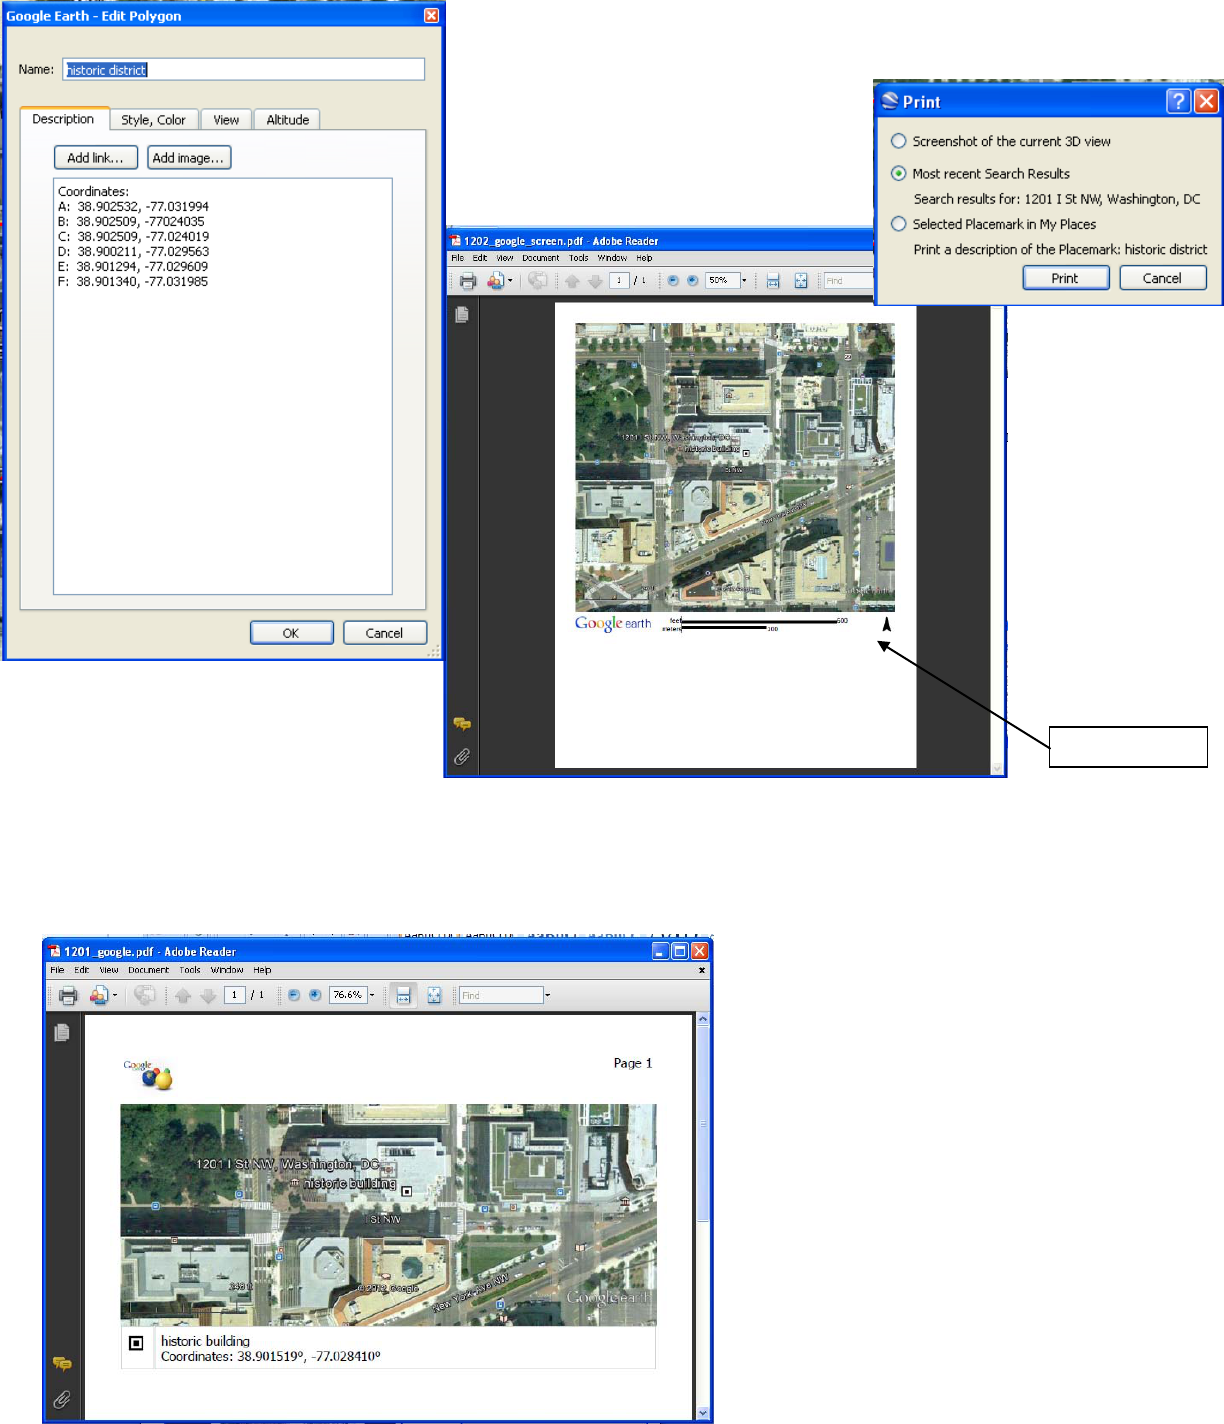
Regardle
ss of whether the user uses searching to find a location, creates
placemarks or draws an area feature, all can be printed directly or to a .pdf
file. From the File and Print menus, users
can choose whether to print the screen
shot (as you see the screen now), or select
specific features in your Places window to
focus on.
This .pdf shows a screen shot. Note the scale and north arrow addition to the page, which are required for a National
Register nomination submission.
This .pdf shows a selected placemark. Note
the name of the feature and label at the
bottom of the image, which also has the scale
legend.
Scale legend
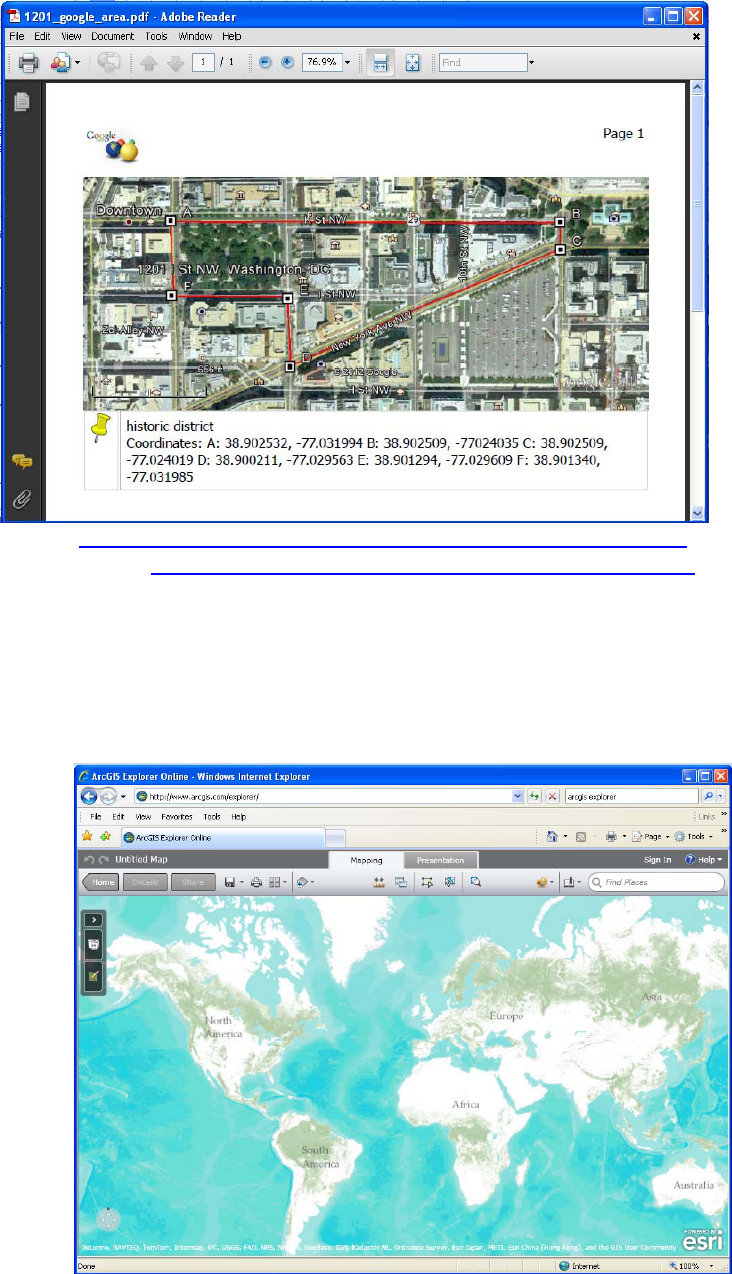
Note that choosing an area feature to print out will also produce the labels and scale bar. These images would replace
the regular USGS quadrangle map required for a nomination.
Like BING Maps, users can save the data produced when making placemarks or area features as .kml or .kmz files. Right
click on the feature in the Places window and select, Save Place As to open the Save dialog box. These files can be
submitted with the electronic nomination,
when this option becomes available.
(
http://www.esri.com/software/arcgis/explorer-online/index.html)
(http://www.esri.com/software/arcgis/explorer/index.html)
ArcGIS Explorer
Made by Environmental Systems Research Institute (ESRI), the same company that produces the primary full GIS
software used, ArcGIS Explorer is a free GIS application. Like Google Earth, users may download the application and
install it. However, like BING Maps, an internet based version that works through a browser is also available. If users
have administrative rights conflicts, the ArcGIS Explorer Online option will avoid any download. Both versions of ArcGIS
Explorer are more like a true GIS software, offering much more functionality than BING Maps or Google Earth. All of the
same options, in terms of collecting coordinates and producing paper maps or electronic files that could be accepted as
part of a National Register nomination are
included, along with other analysis functions
and background data.
ArcGIS Explorer Online
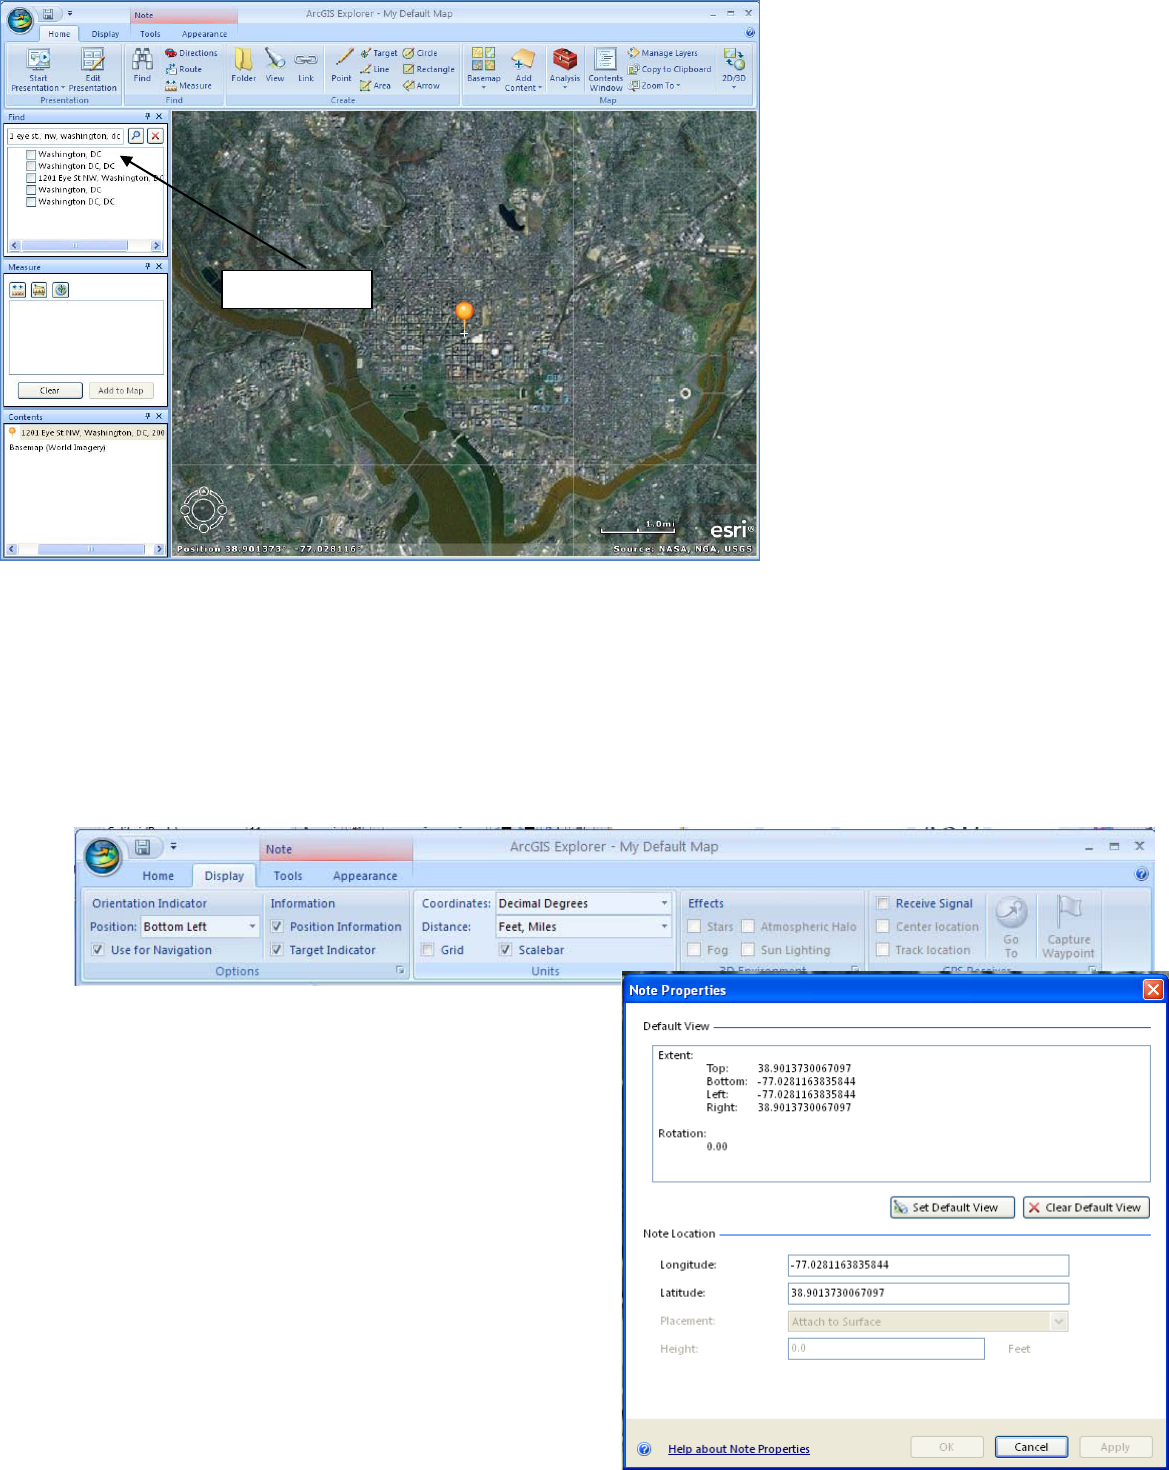
Search box
ArcGIS Explorer Application
Be
cause the ArcGIS Explorer application
is more sophisticated, it will take a little
more time to work with, however the
quality of paper maps that can be
produced is much higher. The
application is not quite as intuitive as
Google Earth or BING Maps, however the
enhanced functionality balances the time
needed to learn all of the tools.
With ArcGIS Explorer, typing an address,
keyword, city or other geographic term
into the search box at the top of the
application window finds the location
and marks it with a pin. To edit the
location, get information about it,
change the symbol or perform any
analysis, users must select the right
search item, right click on the item and
select Move to Map. This action
transfers the item found to the
temporary map being created, moving it
as a data layer to the Contents window. Once in the Contents window, users right click on the item and select Go To, to
zoom into the area of interest. From this same menu, users can change the symbol associated with a feature or add a
label for the feature.
Like Google Earth, users can easily find coordinates associated with a point, line or area feature drawn on the map. Also
Google Earth, users need to define what coordinate system those coordinates will be displayed as on the screen, add
scale information and other map elements. Unlike Google Earth, where the cursor moving changed the coordinates,
ArcGIS Explorer always displays the coordinates associated with the center of the map view. Moving the map image, as
opposed to moving the cursor will update the coordinates displayed at the bottom of the screen.
Click on the Display tab at the top of the application to
select the map elements and details that are needed. Click
in the box next to Position Information to make sure
coordinates display on your screen. Click in the box next
to Target Indicator to display the crosshair at the center of
the map display that will correspond to the coordinates
being displayed on the map. Select Decimal Degrees as
the Coordinate system to make sure that the position
information is displayed in the right format. Choose the
type of distance measure (English or metric) that the
application will use to display any calculations made when
drawing features.

atures
to map
ts
ure window
results
Before drawing any permanent point, line or area features, users can right click on the pin placed in the map based on a
search to get the Properties of a feature, listing the coordinates in decimal degrees. This will be sufficient for resources
under 10 acres, where only a single coordinate is required by the National Register program.
Like Google Earth, tools at the top of the application window allow users to create points, lines or area features. For
each feature drawn, users may enter label information, popup window text or change the feature symbol and color.
Once these feature have been created, they will also appear as layers in the Contents window at the left of the
application.
With ArcGIS Explorer, user
o
ptions to measure
distances and calculate
areas are significantly
enhanced. Clicking on the
Measure tool at the top of
the application window
opens a Measure window at
the left side of the
application. From this
window, users can measure
distances or areas and even
Drawing tools
Labeled feature
New fe
added
conten
Meas
with
find coordinates for individual points. Results from any of the measurements are listed in the window. Users may also
change the units of their measurements at any point. This function will allow users to calculate the acreage figures
required for a National Register nomination.
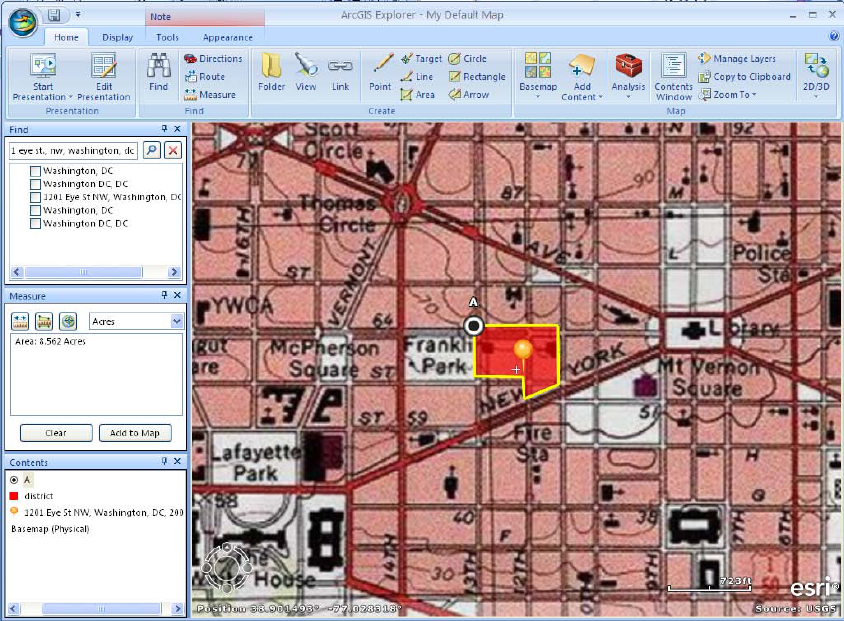
Other tools at the top of the application window allow users to change the basemap or background data from aerial
imagery to something more familiar for a National Register nomination, like a digital quadrangle topographical map.
Clicking on the Basemap menu and selecting Physical, should load new data into the map display.
Users have many options
of alternate basemaps to
choose from in ArcGIS
Explorer. Users may also
add in other GIS data or
other .kml or .kmz files
created in other
applications like Google
Earth.
However, users change
the display with different
symbols, labels,
background information,
etc., everything can be
printed out on a paper
map, sent to a .pdf, or
exported as a .kml or .kmz
file.
From the File and print
wh
ether to print the map created directly or to a .pdf file. Information on the screen, such as labels (which could
contain the appropriate coordinates or property names) will all be included on the paper map along with scale and other
information. Users can choose to save the map itself in order to return to it at a later point, or they can save the
individual data layers as separate files.
men
us, users can choose
All three of these options will produce the main requirements: coordinates (either UTM or decimal degrees) and a
paper locator map with scale, labels and coordinate information contained on it. The method used to create these
products depends on the user, the resource type and the needs for the paper map in particular.
Note: The National Register nomination form will be including space for decimal degree coordinates in addition to UTM
c
oordinates. Datum information is also being requested. All of the internet based applications described here are
generating coordinates based on a World Geodetic System 1984 datum (WGS84). This is common for data with world
coverage, such as GPS data as well. Datum information for UTM coordinates generated off of paper quadrangle maps
should be located in the collar of the map and be either North American Datum 1927 (NAD27) or North American Datum
1983 (NAD83). Decimal degree coordinates entered onto the National Register nomination form should be carried out 6
decimal places.
BING Maps
Pros
•
•
•
•
•
•
Dec
imal degree coordinates easily produced from
typing in an address
Point, line and area features can be drawn on the
map using intuitive tools
Perimeter and area figures will be automatically
generated when an area feature is drawn
Background data can be changed from streets to
aerial imagery to assist in finding locations
Maps produced can be easily printed directly to
paper or to a .pdf file
Point, line and area features drawn can be exported
as .kml or .kmz files
Cons
•
•
•
•
Deci
mal degree coordinates can not be defined
without an address to type into the search box
Although area features can be drawn on the map,
getting bounding coordinates is difficult
Although perimeter and area figures are
automatically calculated for area features, the units
can not be changed to show acreage
Adding labels to the map display, changing the
symbols of features in the map or changing colors
of symbols is not possible
Google Earth
Pros
• C
oordinates constantly displayed on the screen and
up
dated as the user moves the cursor
• Coordinate format can be
changed from UTM to
decimal degrees
• Scale bar information can be added to the display
• Point, line and area features can be drawn on the
ma
p using intuitive tools
• Point, line and area features can be labeled easily
• Point, line and area symbols can be changed easily
• Point, line and area features added to the display
can
be turned “off” in the display easily
• Historic aerial imagery can be displayed, in addition
to
“street view” data
• Maps produced can be easily printed directly to
pap
er in multiple formats or to a .pdf file
• Point, line and area features drawn can be exported
as .
kml or .kmz files
Cons
•
•
•
•
Users
without administrative rights on their
computers can not install the application
Area and perimeter figures are not calculated
Background data can not be changed from imagery
Getting bounding coordinates will require manually
moving the cursor to the appropriate location to
display coordinates, but these can be easily copied
into labels or points can be created
ArcGIS Explorer
Pros
•
•
•
•
•
•
•
•
•
•
•
•
•
•
•
Users can choose to install the application or use it
through an internet browser, depending on
whether they have administrative rights on their
computers
ArcGIS Explorer has many more functions and
analysis
capabilities
Coordinates constantly displayed on the screen and
upd
ated as the user moves the display past the
center point indicator
Coordinate format can be changed from UTM to
decimal degrees
Scale bar information can be added to the display
Point, line and area features can be drawn on the
map using intuitive tools
Point, line and area features can be labeled easily
Point, line and area symbols can be changed easily
Point, line and area features added to the display
can be turned “off” in the display easily
Distance, area and perimeter figures can be easily
calculated, in a variety of units selected by the user
Background data can be changed from imagery to a
variety of other options, including the familiar USGS
quadrangle map
Other data files generated by GPS or through a full
GIS can be added to the map view
Maps created can be saved for use, edit or update
at a later time
Maps produced can be easily printed directly to
paper in multiple formats or to a .pdf file
Point, line and area features drawn can be exported
as .kml or .kmz files
Cons
• Beca
use ArcGIS Explorer is more sophisticated and
has more functionality, it is less intuitive and may
take more time to work with
For further information, contact the Cultural Resource GIS Facility at deidre_[email protected].
